What does the future hold for business? Ask nine experts and you’ll get ten answers.
It’s a bull market. It’s a bear market. Rates will rise or fall. Inflation’s up or down. Can someone invent a crystal ball?
Over 43,000 businesses have future-proofed their business with NetSuite, by Oracle - the number one AI cloud E.R.P., bringing accounting, financial management, inventory, and HR, into one platform. With real-time insights and forecasting, you’re able to peer into the future and seize new opportunities. Whether your company is earning millions or even hundreds of millions, NetSuite helps you respond to immediate challenges and seize your biggest opportunities.
Download the CFO’s Guide to AI and Machine Learning for FREE.
I talk to a lot of CFOs and CEOs.
And the hot button topic of late has been unit economics…
Why unit economics matter again, and
How to get to a customer level P&L
Arriving at a reliable and accurate contribution margin by customer is Nirvana for a PE backed company. It exposes the levers you can pull to ensure you are serving the most profitable customer profile, rather than treating all your customers the same.
It’s scary how most companies don’t realize they have craters in their P&L, in the form of customers who eat up 80% of their resources and only contribute 20% to their bottom line (or worse, are actually losing them money).
But the road to contribution margin by customer is laden with misconceptions, bad advice, and hard-to-read directions.
So I brought in two pros to take us to the promised land - Fred Sitnik, the CEO and Co-Founder of Margin, and Claire (King) Krikawa, a Director on the Value Creation Team at LLR Partners. They’re in the trenches applying these frameworks each and everyday.
Take it away!

In the post-ZIRP era there’s been uniform acknowledgement that unit economics matter. And it’s true: CFOs are being pressured by their boards, and companies are struggling to prove profitable growth to attract more necessary capital.
Everyone is expecting better unit economics, but no one tells you how to make meaningful steps towards improved margins.
The status quo in most companies today is that you are working with simplified profitability metrics. BIPS (Basis points) are a great scoreboard, but they’re not a playbook.
LTV, CAC, and margin, reported as single numbers, won’t tell you where to pull back discounts, which customers are worth upselling, or which segments quietly burn cash; they’re overly simplified metrics with multiple underlying levers.
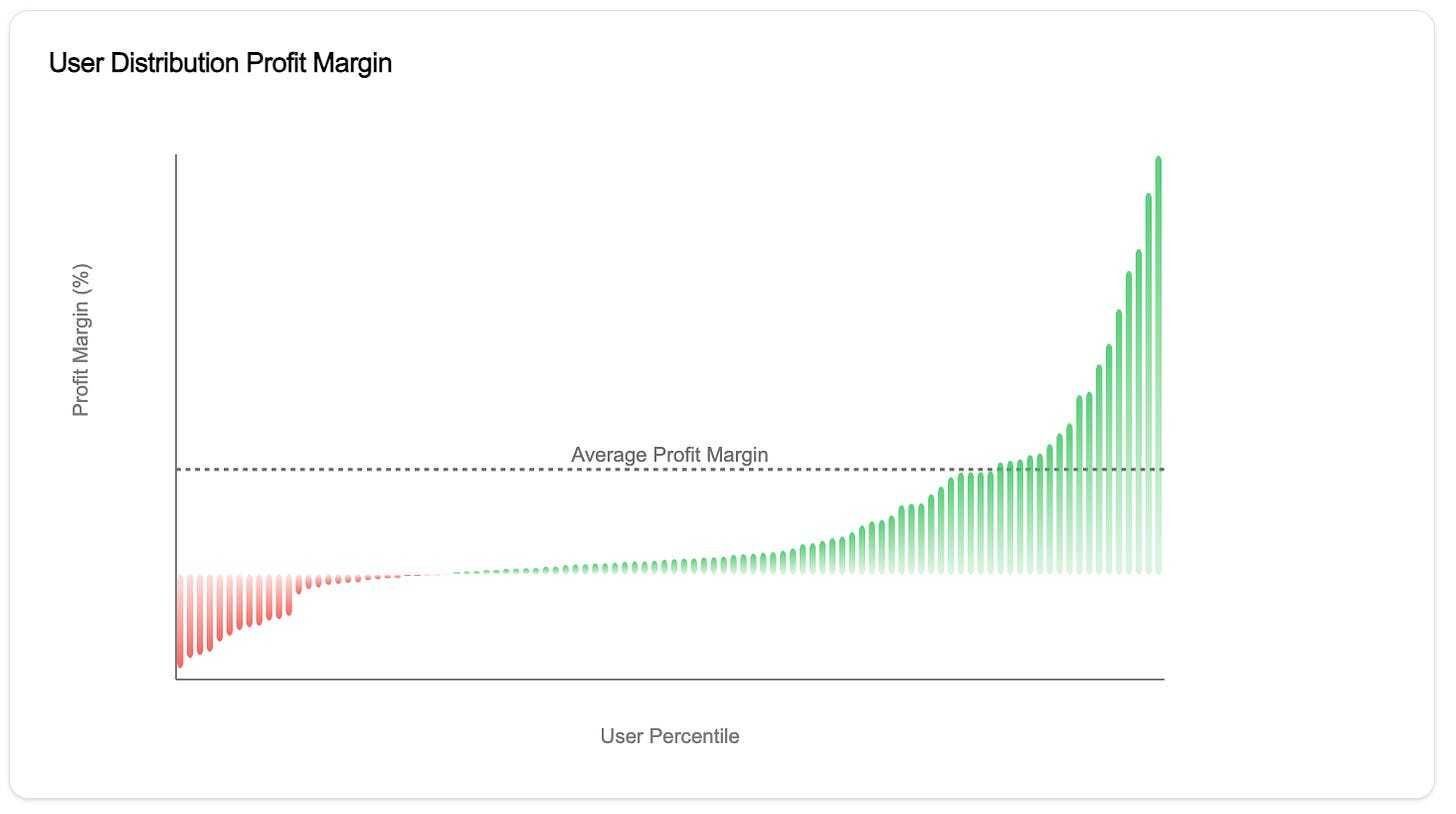
This is easy to visualize by looking at the graph below which represents the margin distribution of a hypothetical healthy business. In this example, a small subset of super-customers generates most profits, while another harder-to-identify segment generates most losses.

If this resonates, you’re not alone.
Many growth-stage businesses have prioritized top-line bookings and have ‘grown at any cost.’ If Rule of 40 is now consuming your every waking moment, unit economics are your new best friend.
So let’s start with a (seemingly) simple question: why are unit economics critical?
1) Revenue is a bad stand-in for profit.
Customers consume different feature mixes and service levels. All with differing profitability profiles.
I’ll say that again: not all customers buy the same thing or consume it at the same frequency. That weighs differently on your P&L.
Example: After building a user-level P&L, one company we chatted with noticed that when they split it out by user age, seniors were very unprofitable, despite generating lots of revenue.
Why? Seniors were responsible for over 80% of customer support usage.
Simple product communication adjustments towards older users generated a 25% contribution margin increase for the whole business. Crazy stuff.
2) A cohort-only P&L leaves money on the table.
Time of customer acquisition or location rarely explain margin. Yet, they are the focal point of most cohort level analyses.
Some interesting cuts enabled by granular margin analysis include:
Contribution-margin bands: rank by CM and then compare unit COGS and variable OPEX by band.
Feature mix: identify costly features overused by low-CM accounts, favoring high-GM ones.
Contract/pricing mechanics: eliminate legacy discounts, credits, bad tier floors.
Example: After building a user-level P&L for one of our customers, we noticed that they were missing large segments of users with over 3x the profitability of their ICP.
They initially constructed the ICP based on a cohort-level view of profit by location and feature use.
But they completely missed nuances related to customer attributes, like the industry they operate in.
A granular P&L helped us understand all of those nuances to define the true highest LTV cohorts, thus changing the ICP.
Pushing this data into marketing, was one of the easiest ways to significantly increase their LTV/CAC.
3) Granular Contribution Margin forces healthy decision making
Per-customer contribution margin turns first-month signals into reliable LTV forecasts. You can decide early: expand, fix, or exit.
Example: One payments company we chatted with attracted over 10k customers away from competitors.
But after two years they noticed they were losing insane amounts of money. It turned out those users were fired by competitors due to high fraud rates and a loss-generating payment mix.
A customer-level P&L would have saved millions here.
First, they would have been able to quickly distinguish that this sub-segment of users produces a loss-generating payment method mix.
Second, user-level LTV forecasts would give the data and confidence to fix or exit specific customers.
Ultimately, the solution to improving overall unit economics is being obsessed about your user-level P&L.
This allows you to embed profit-driven decision making into all major areas of business:
Growth/GTM: using user-level profit and LTV to understand who to chase with marketing dollars
Pricing: understanding the profit-impact of each pricing term with customers and vendors
Solving margin leakage: addressing excessive implementation / support consumers, finding undesirable customers, identifying missed cross-selling opportunities, etc.
Whether you are a venture-backed hypergrowth company or a family-owned business, this approach allows you to “PE-yourself”. It allows you to shine in front of your board, finally make truly ROI-driven decisions, or simply feel good about building a healthy business.
Bringing detailed insights about margin detractors and mitigation strategies to meetings with your investors will promote more productive discussions around topics like customer service delivery models, pricing discipline, and renewal strategies.
Okay, hopefully some of you see how a granular P&L could be useful. Now, let’s get to the big question.

How can you implement a customer-level P&L in your business?
Building a granular P&L requires taking revenue and cost lines that haven’t yet been allocated on a customer-level, and creating the allocation.
Start by allocating the buckets that matter most. Prioritize items that
Drive a big share of margin
Vary widely by customer
Are easy to attribute.
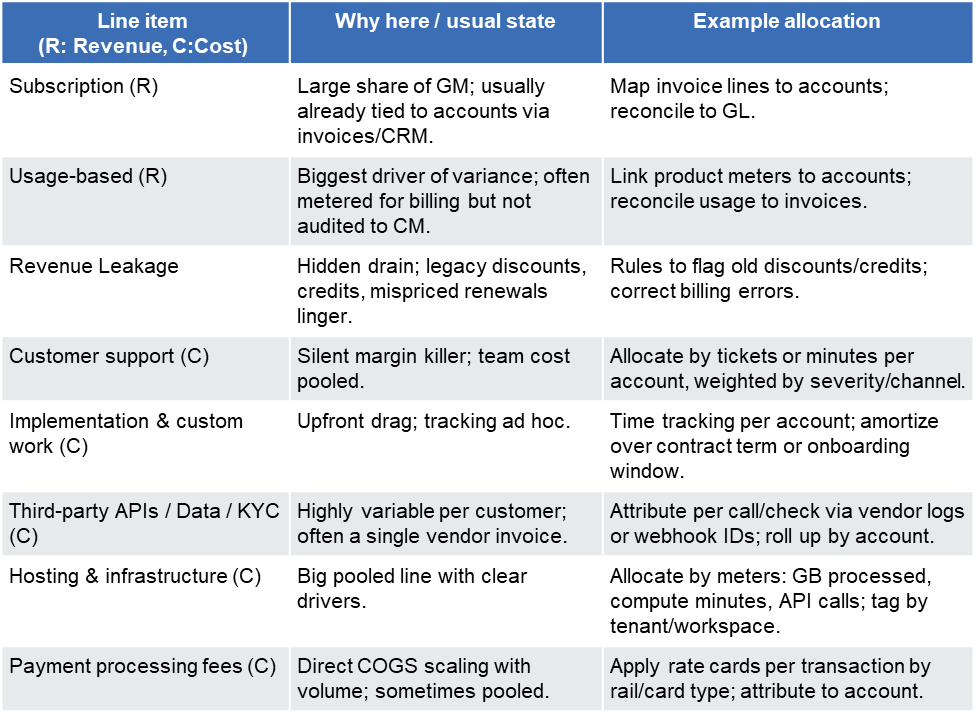
For a typical SaaS business, the order looks like this (highest priority first):

The worst feeling in the world is being stuck allocating an irrelevant but especially complicated cost line (we’ve been there).
Again, it’s really important to make sure to first focus on items that meet the three criteria above (margin, variability, and attribution). We’ve seen how lots of SaaS companies don’t focus enough on customer support, implementation, and custom feature development. Prioritize according to the criteria above to avoid getting your data team and yourself frustrated!
Now you are ready to partner with your data team to execute:
Extract customer-level ops data. Vendor API calls, support tickets, transactions, usage meters. (Data team leads.)
Define allocation logic. Per-unit attribution vs. proportional spreads; align to how vendors charge. (Finance leads; data implements.)
Run sanity checks. Reconcile the new customer-level model to the accounting P&L and GL. Fix discrepancies before sharing with leadership. (Finance leads, data modifies models if incorrect)
Having established how to create those models, let’s discuss two types of outputs companies generally end-up with:
1) Excel snapshot (retrospective, one-off)
A workbook that joins exports to produce customer-level contribution margin for a past period.
Pros
Fastest to ship (often <6 weeks); finance-led.
Great for baseline sizing: rank CM/customer, spot leakage, validate allocation logic.
Useful for one-off pricing/contract reviews and identifying which directional areas to address.
Cons
Static; goes stale quickly and hides trends/seasonality.
Manual + fragile (refreshing requires manually pulling data together, changes to logic can be hard to implement)
Limited granularity (some costs will be simply too hard to allocate correctly)
Hard to operationalize in every-day decisions around growth, pricing, and more.
2) Real‑time (or near‑real‑time) refreshing model
Warehouse + pipelines + metric layer; updates daily/hourly; feeds dashboards/alerts.
Pros
Refreshes often making it easy to spot trends or changes in profitability profiles
Fully granular and reconciled to the accounting P&L giving confidence in data
Easily embeddable into key profitability driving decisions: which customers to target in GTM, pricing, identifying margin leakage, etc.
Cons
Longer build; needs data/engineering + metric governance.
Requires ongoing maintenance and data‑quality monitoring.
Good luck on building (or improving) your customer-level PnL. If you have any questions or would like a brainstorming session around this, reach out to Fred.
Hey, it’s Fryderyk, the co-founder & ceo at Margin. I previously built a loyalty fintech company and tracking granular unit economics was a nightmare for me. I started Margin to help myself and other companies build a customer-level P&L and drive decisions on growth and pricing. We built an AI tool that helps clean up financial data quickly and we use forward-deployed engineers to handle edge cases and integrations for customers. If you are intrigued by the idea of getting to a granular PnL but are worried about internal resources and costs, we should talk.
You can reach me by going to viewmargin.com or reaching out at [email protected]
Hi there - I’m Claire (King) Krikawa, a Director on the Value Creation Team at LLR Partners. In my role leading our Operational Excellence function, I partner with portfolio CFOs to improve operating margins through vendor spend reviews, unit economics analyses, and PnL benchmarking. LLR Partners is a lower middle market private equity firm focused on investing in software and tech-enabled companies within the knowledge economy. Founded in 1999 and headquartered in Philadelphia, LLR has raised over $7.5 billion across seven funds and has partnered with over 130 companies.
You can learn more about LLR by visiting llrpartners.com or you can reach me at [email protected]
The views and opinions expressed in this article are solely those of the authors and do not necessarily reflect the perspectives of their respective employers, colleagues, or any affiliated organizations. We’re sharing our personal experiences and ideas in the spirit of open discussion and collaboration. While our professional backgrounds have shaped how we think about these topics, the insights here are our own. We welcome diverse viewpoints and encourage readers to draw their own conclusions.
Thanks for reading, and make sure to check out our sponsor, NetSuite.
Download the CFO’s Guide to AI and Machine Learning for FREE.
